Section 1: Using the GUI (Recommended)
The GUI application provides an intuitive control dashboard, making it the perfect choice for non-technical users and business owners.
Step 1: Launch the DashDraft GUI App
- macOS: Open your
Applicationsdirectory and double-click DashDraft. - Windows: Select the DashDraft icon inside your Start Menu or double-click the Desktop shortcut.
- Linux: Run
dashdraft-guiinside your shell or click the DashDraft entry in your desktop Applications list.
Step 2: Locate the "Core Service" card
At the top of the interface, you'll find the Core Service section. Look for the status indicator text:
- Stopped — The background database engine is currently inactive.
- Running — The database and dashboard are fully functional and ready.
Step 3: Click "Start DashDraft"
If the service status shows Stopped, simply click the blue Start DashDraft button.
Within seconds, the status badge will transition to a vibrant green Running indicator, signaling the engine is spin up.
Step 4: Launch the Web Dashboard
Once active, the GUI displays the local Dashboard URL (by default, http://localhost:7700).
Click the primary Open Dashboard button to automatically open the interface in your default web browser, or copy the URL to paste it manually.
GUI Core Service Interface
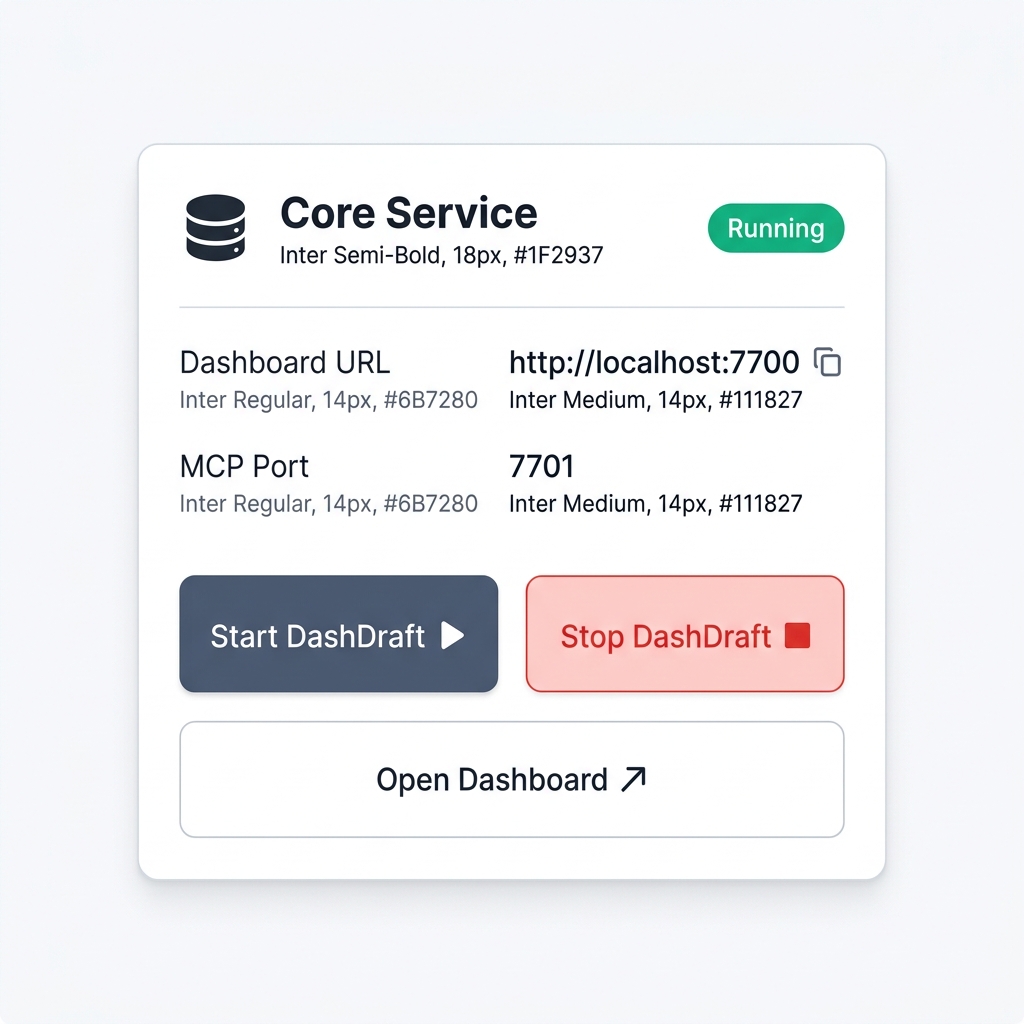
- Status indicator: Displays the green running badge indicating background database systems are operational.
- Open Web Dashboard button: One-click browser access launcher.
- Dashboard URL: Shows the active address
http://localhost:7700. - Stop Service button: Instantly powers down database endpoints cleanly.
Section 2: Using the CLI (Optional)
For advanced users who prefer working in terminal-based environments, you can start the service using the CLI:
dashdraft startThis spins up the same local database system and hosts the dashboard on port 7700.
Navigating your dashboard
Once DashDraft is running and you have opened the browser dashboard:
- Create your first workspace folder.
- Drag and drop your CSV datasets to import them.
- Proceed to hook up an AI assistant to start asking questions!